See exactly when your site slowed down
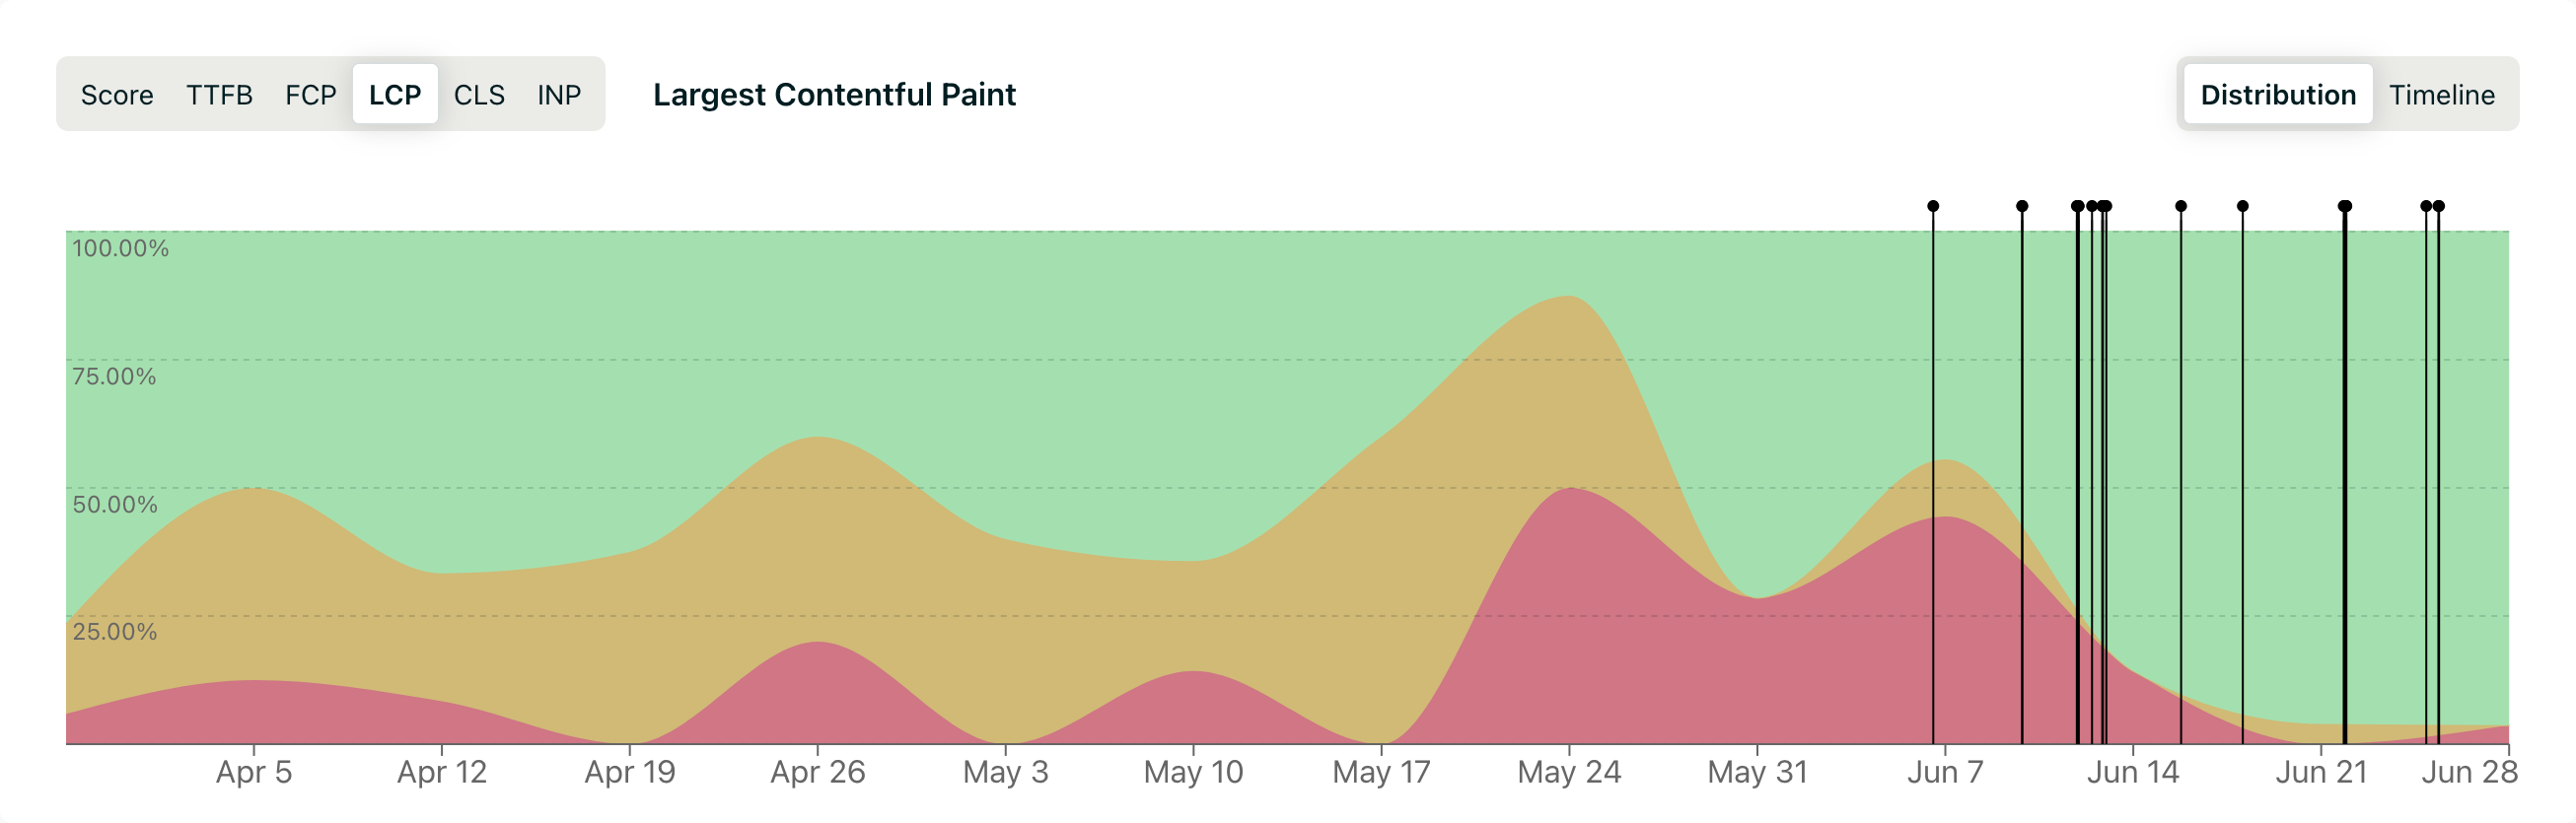
Connect your GitHub repository and every push to your monitored branches gets marked on your performance timeline. When something changes, youʼll know which commit to look at.
How it works
During setup, you link a GitHub repository to your website and map each of your domains to a branch. Your production domain to main, your staging domain to a staging branch — however your workflow is set up. Every push to a mapped branch drops a marker on your timeline. Click it and you're taken straight to the commit on GitHub. If your setup changes, the same configuration is available any time from your site settings.
Why it matters
Performance regressions rarely announce themselves. A dependency update, a new font, an image that slipped through without being optimised — any of these can move your LCP by seconds and you'd never know when it happened without digging through your git log manually. Nightingale puts your deployment history and your performance data on the same timeline, so the correlation is obvious.
Frequently Asked Questions
Which GitHub permissions does Nightingale need?
Only repository contents. That covers everything needed to read your branches and receive push events. No access to issues, pull requests, or anything else.
Can I map more than one domain to a repository?
Yes. You can map as many domain and branch pairs as you need — production, staging, preview environments, whatever your setup looks like.
Can I change the configuration after setup?
Yes. The same form used during onboarding is available any time from your site settings.
Stop guessing which deploy slowed down your website
Connect your dashboard to GitHub and see exactly which commit slowed things down.